There have been a few posts about SSMS Activity Monitor recently.
First Kendra Little (b | t) talked about why she doesn’t like it and then Guy Glanster (b | t) and Matan Yungman (b | t) also discussed the failings of Activity Monitor on their SQL Server Radio podcast – mainly it’s to do with the way that wait types are mis-reported.
Looking at Kendra’s post reminded me of something that I’ve been meaning to blog about for a long time – and it’s right there in her first image – a greyed out graph for Processor time on Activity Monitor. The first time I saw this I was confused as to why it was like that and not giving me the correct graph, especially as I was connected in SSMS as sa.
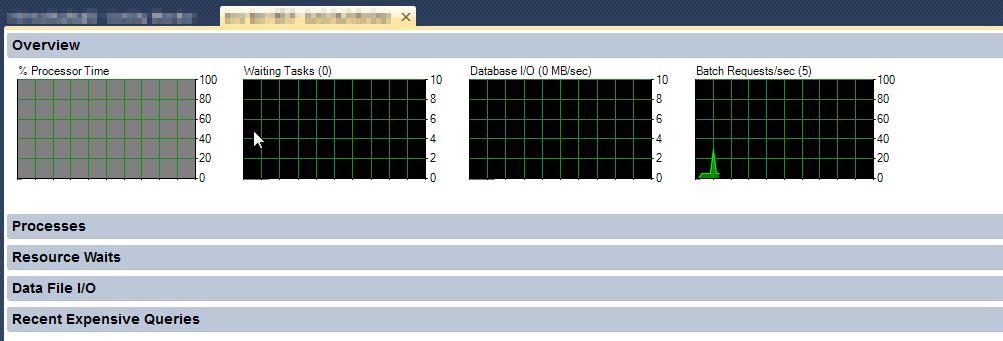
Eurgh
But the reason is simple – Activity Monitor uses performance counters from the underlying Windows server to draw that graph – if you are not connected (in SSMS) with an account that has administrative permissions on the Windows server, or at least is a member of the Performance Monitor Users group, then the data is not retrieved. The most common scenarios are :
- When you have logged on using a SQL Login
- Accessing a remote server in a domain-less hosted environment
- Accessing a server in a domain other than you are locally logged in to
There are other reasons for this behaviour too, but generally all come down to the ability of SSMS, using the credentials that you have logged on to the server with, to access the performance counters.
Another reported reason is when SQL Server is registered in SSMS with a fully qualified domain name : https://connect.microsoft.com/SQLServer/feedback/details/426097/ssms-activity-monitor-does-not-show-processor-time-for-servers-registered-by-fqdn
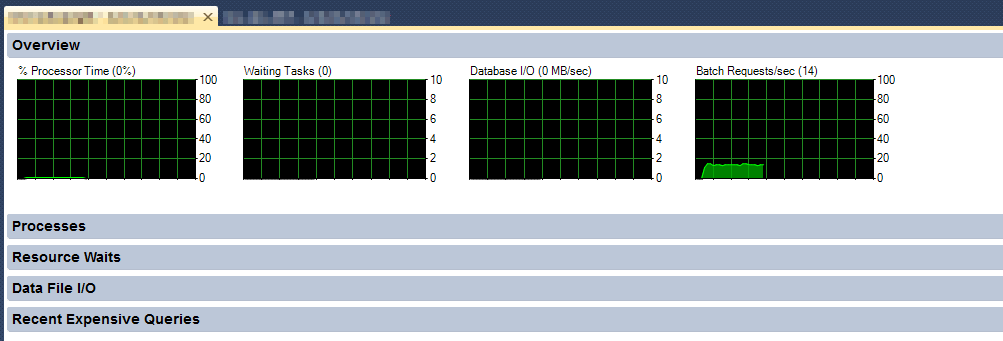
Better!